> ## Documentation Index
> Fetch the complete documentation index at: https://private-7c7dfe99-mintlify-3a82795f.mintlify.site/llms.txt
> Use this file to discover all available pages before exploring further.
# Managed
> Deploying Managed ClickStack
export const TrackedLink = ({href, eventName, children, ...rest}) => {
const handleClick = () => {
try {
if (typeof window !== "undefined" && window.galaxy && eventName) {
window.galaxy.track(eventName, {
interaction: "click"
});
}
} catch (e) {}
};
return
{children}
;
};
export const Image = ({img, alt, size}) => {
return
 ;
};
This **guide is for existing users of ClickHouse Cloud**. If you're new to ClickHouse Cloud, we recommend our [Getting Started](/clickstack/getting-started/managed) guide for Managed ClickStack.
In this deployment pattern, both ClickHouse and the ClickStack UI (HyperDX) are hosted in ClickHouse Cloud, minimizing the number of components the user needs to self-host.
As well as reducing infrastructure management, this deployment pattern ensures authentication is integrated with ClickHouse Cloud SSO/SAML. Unlike self-hosted deployments, there is also no need to provision a MongoDB instance to store application state — such as dashboards, saved searches, user settings, and alerts. Users also benefit from:
* Automatic scaling of compute independent of storage
* Low-cost and effectively unlimited retention based on object storage
* The ability to independently isolate read and write workloads with Warehouses.
* Integrated authentication
* Automated backups
* Security and compliance features
* Seamless upgrades
In this mode, data ingestion is entirely left to the user. You can ingest data into Managed ClickStack using your own hosted OpenTelemetry collector, direct ingestion from client libraries, ClickHouse-native table engines (such as Kafka or S3), ETL pipelines, or ClickPipes — ClickHouse Cloud's managed ingestion service. This approach offers the simplest and most performant way to operate ClickStack.
;
};
This **guide is for existing users of ClickHouse Cloud**. If you're new to ClickHouse Cloud, we recommend our [Getting Started](/clickstack/getting-started/managed) guide for Managed ClickStack.
In this deployment pattern, both ClickHouse and the ClickStack UI (HyperDX) are hosted in ClickHouse Cloud, minimizing the number of components the user needs to self-host.
As well as reducing infrastructure management, this deployment pattern ensures authentication is integrated with ClickHouse Cloud SSO/SAML. Unlike self-hosted deployments, there is also no need to provision a MongoDB instance to store application state — such as dashboards, saved searches, user settings, and alerts. Users also benefit from:
* Automatic scaling of compute independent of storage
* Low-cost and effectively unlimited retention based on object storage
* The ability to independently isolate read and write workloads with Warehouses.
* Integrated authentication
* Automated backups
* Security and compliance features
* Seamless upgrades
In this mode, data ingestion is entirely left to the user. You can ingest data into Managed ClickStack using your own hosted OpenTelemetry collector, direct ingestion from client libraries, ClickHouse-native table engines (such as Kafka or S3), ETL pipelines, or ClickPipes — ClickHouse Cloud's managed ingestion service. This approach offers the simplest and most performant way to operate ClickStack.
Suitable for
This deployment pattern is ideal in the following scenarios:
1. You already have observability data in ClickHouse Cloud and wish to visualize it using ClickStack.
2. You operate a large observability deployment and need the dedicated performance and scalability of ClickStack running on ClickHouse Cloud.
3. You're already using ClickHouse Cloud for analytics and want to instrument your application using ClickStack instrumentation libraries — sending data to the same cluster. In this case, we recommend using [warehouses](/products/cloud/features/infrastructure/warehouses) to isolate compute for observability workloads.
Setup steps
The following guide assumes you have already created a ClickHouse Cloud service. If you haven't created a service, follow the [Getting Started](/clickstack/getting-started/managed) guide for Managed ClickStack. This will leave you with a service in the same state as this guide i.e. ready for observability data with ClickStack enabled.
Create a new service
From the ClickHouse Cloud landing page, select `New service` to create a new service.
Specify your provider, region and resource
**Scale vs Enterprise**
We recommend this [Scale tier](/products/cloud/features/cloud-tiers) for most ClickStack workloads. Choose the Enterprise tier if you require advanced security features such as SAML, CMEK, or HIPAA compliance. It also offers custom hardware profiles for very large ClickStack deployments. In these cases, we recommend contacting support.
Select the Cloud provider and region.
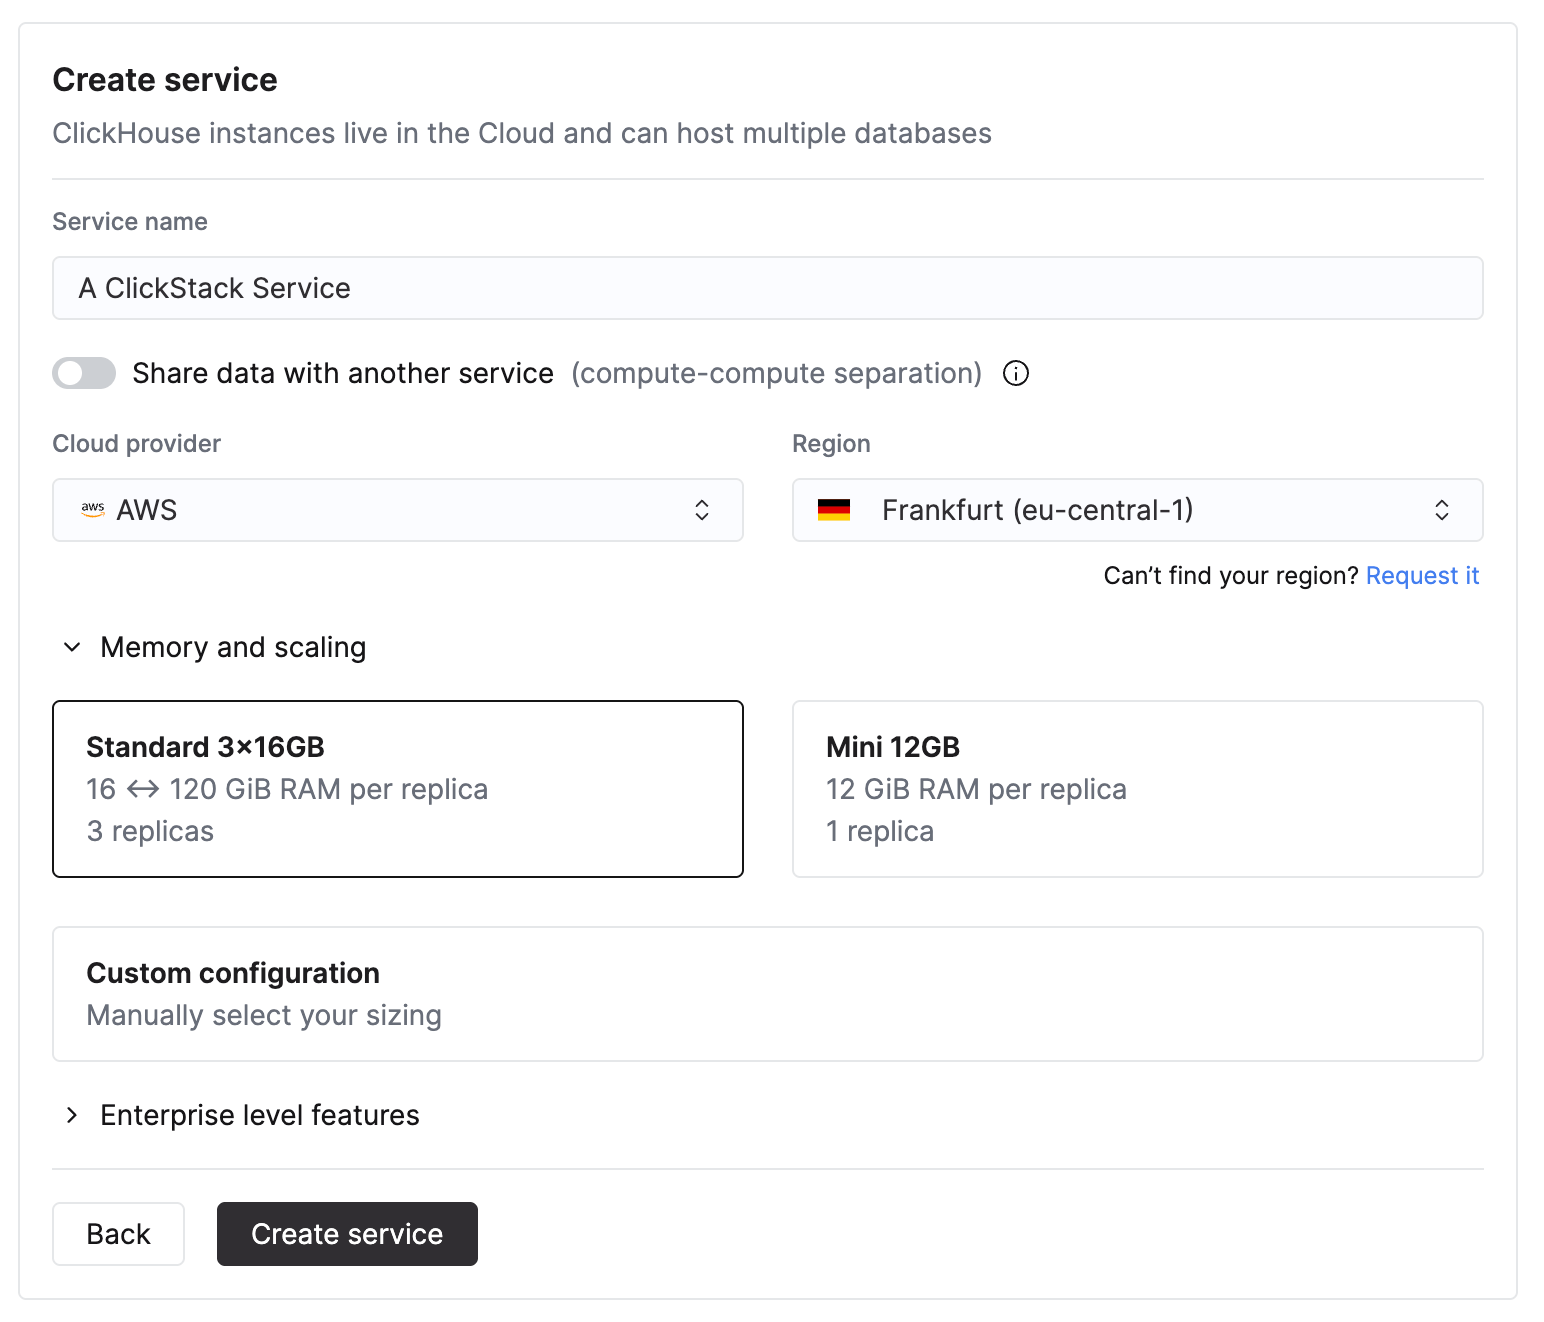 When specifying the select CPU and memory, estimate it based on your expected ClickStack ingestion throughput. The table below provides guidance for sizing these resources.
| Monthly ingest volume | Recommended compute |
| --------------------- | -------------------- |
| \< 10 TB / month | 2 vCPU × 3 replicas |
| 10–50 TB / month | 4 vCPU × 3 replicas |
| 50–100 TB / month | 8 vCPU × 3 replicas |
| 100–500 TB / month | 30 vCPU × 3 replicas |
| 1 PB+ / month | 59 vCPU × 3 replicas |
These recommendations are based on the following assumptions:
* Data volume refers to **uncompressed ingest volume** per month and applies to both logs and traces.
* Query patterns are typical for observability use cases, with most queries targeting **recent data**, usually the last 24 hours.
* Ingestion is relatively **uniform across the month**. If you expect bursty traffic or spikes, you should provision additional headroom.
* Storage is handled separately via ClickHouse Cloud object storage and isn't a limiting factor for retention. We assume data retained for longer periods is infrequently accessed.
More compute may be required for access patterns that regularly query longer time ranges, perform heavy aggregations, or support a high number of concurrent users.
Although two replicas can meet the CPU and memory requirements for a given ingestion throughput, we recommend using three replicas where possible to achieve the same total capacity and improve service redundancy.
These values are **estimates only** and should be used as an initial baseline. Actual requirements depend on query complexity, concurrency, retention policies, and variance in ingestion throughput. Always monitor resource usage and scale as needed.
Once you have specified the requirements, your Managed ClickStack service will take several minutes to provision. Feel free to explore the rest of the [ClickHouse Cloud console](/products/cloud/getting-started/intro) whilst waiting for provisioning.
Once **provisioning is complete, the 'ClickStack' option on the left menu will be enabled**.
When specifying the select CPU and memory, estimate it based on your expected ClickStack ingestion throughput. The table below provides guidance for sizing these resources.
| Monthly ingest volume | Recommended compute |
| --------------------- | -------------------- |
| \< 10 TB / month | 2 vCPU × 3 replicas |
| 10–50 TB / month | 4 vCPU × 3 replicas |
| 50–100 TB / month | 8 vCPU × 3 replicas |
| 100–500 TB / month | 30 vCPU × 3 replicas |
| 1 PB+ / month | 59 vCPU × 3 replicas |
These recommendations are based on the following assumptions:
* Data volume refers to **uncompressed ingest volume** per month and applies to both logs and traces.
* Query patterns are typical for observability use cases, with most queries targeting **recent data**, usually the last 24 hours.
* Ingestion is relatively **uniform across the month**. If you expect bursty traffic or spikes, you should provision additional headroom.
* Storage is handled separately via ClickHouse Cloud object storage and isn't a limiting factor for retention. We assume data retained for longer periods is infrequently accessed.
More compute may be required for access patterns that regularly query longer time ranges, perform heavy aggregations, or support a high number of concurrent users.
Although two replicas can meet the CPU and memory requirements for a given ingestion throughput, we recommend using three replicas where possible to achieve the same total capacity and improve service redundancy.
These values are **estimates only** and should be used as an initial baseline. Actual requirements depend on query complexity, concurrency, retention policies, and variance in ingestion throughput. Always monitor resource usage and scale as needed.
Once you have specified the requirements, your Managed ClickStack service will take several minutes to provision. Feel free to explore the rest of the [ClickHouse Cloud console](/products/cloud/getting-started/intro) whilst waiting for provisioning.
Once **provisioning is complete, the 'ClickStack' option on the left menu will be enabled**.
Setup ingestion
Once your service has been provisioned, ensure the the service is selected and click "ClickStack" from the left menu.
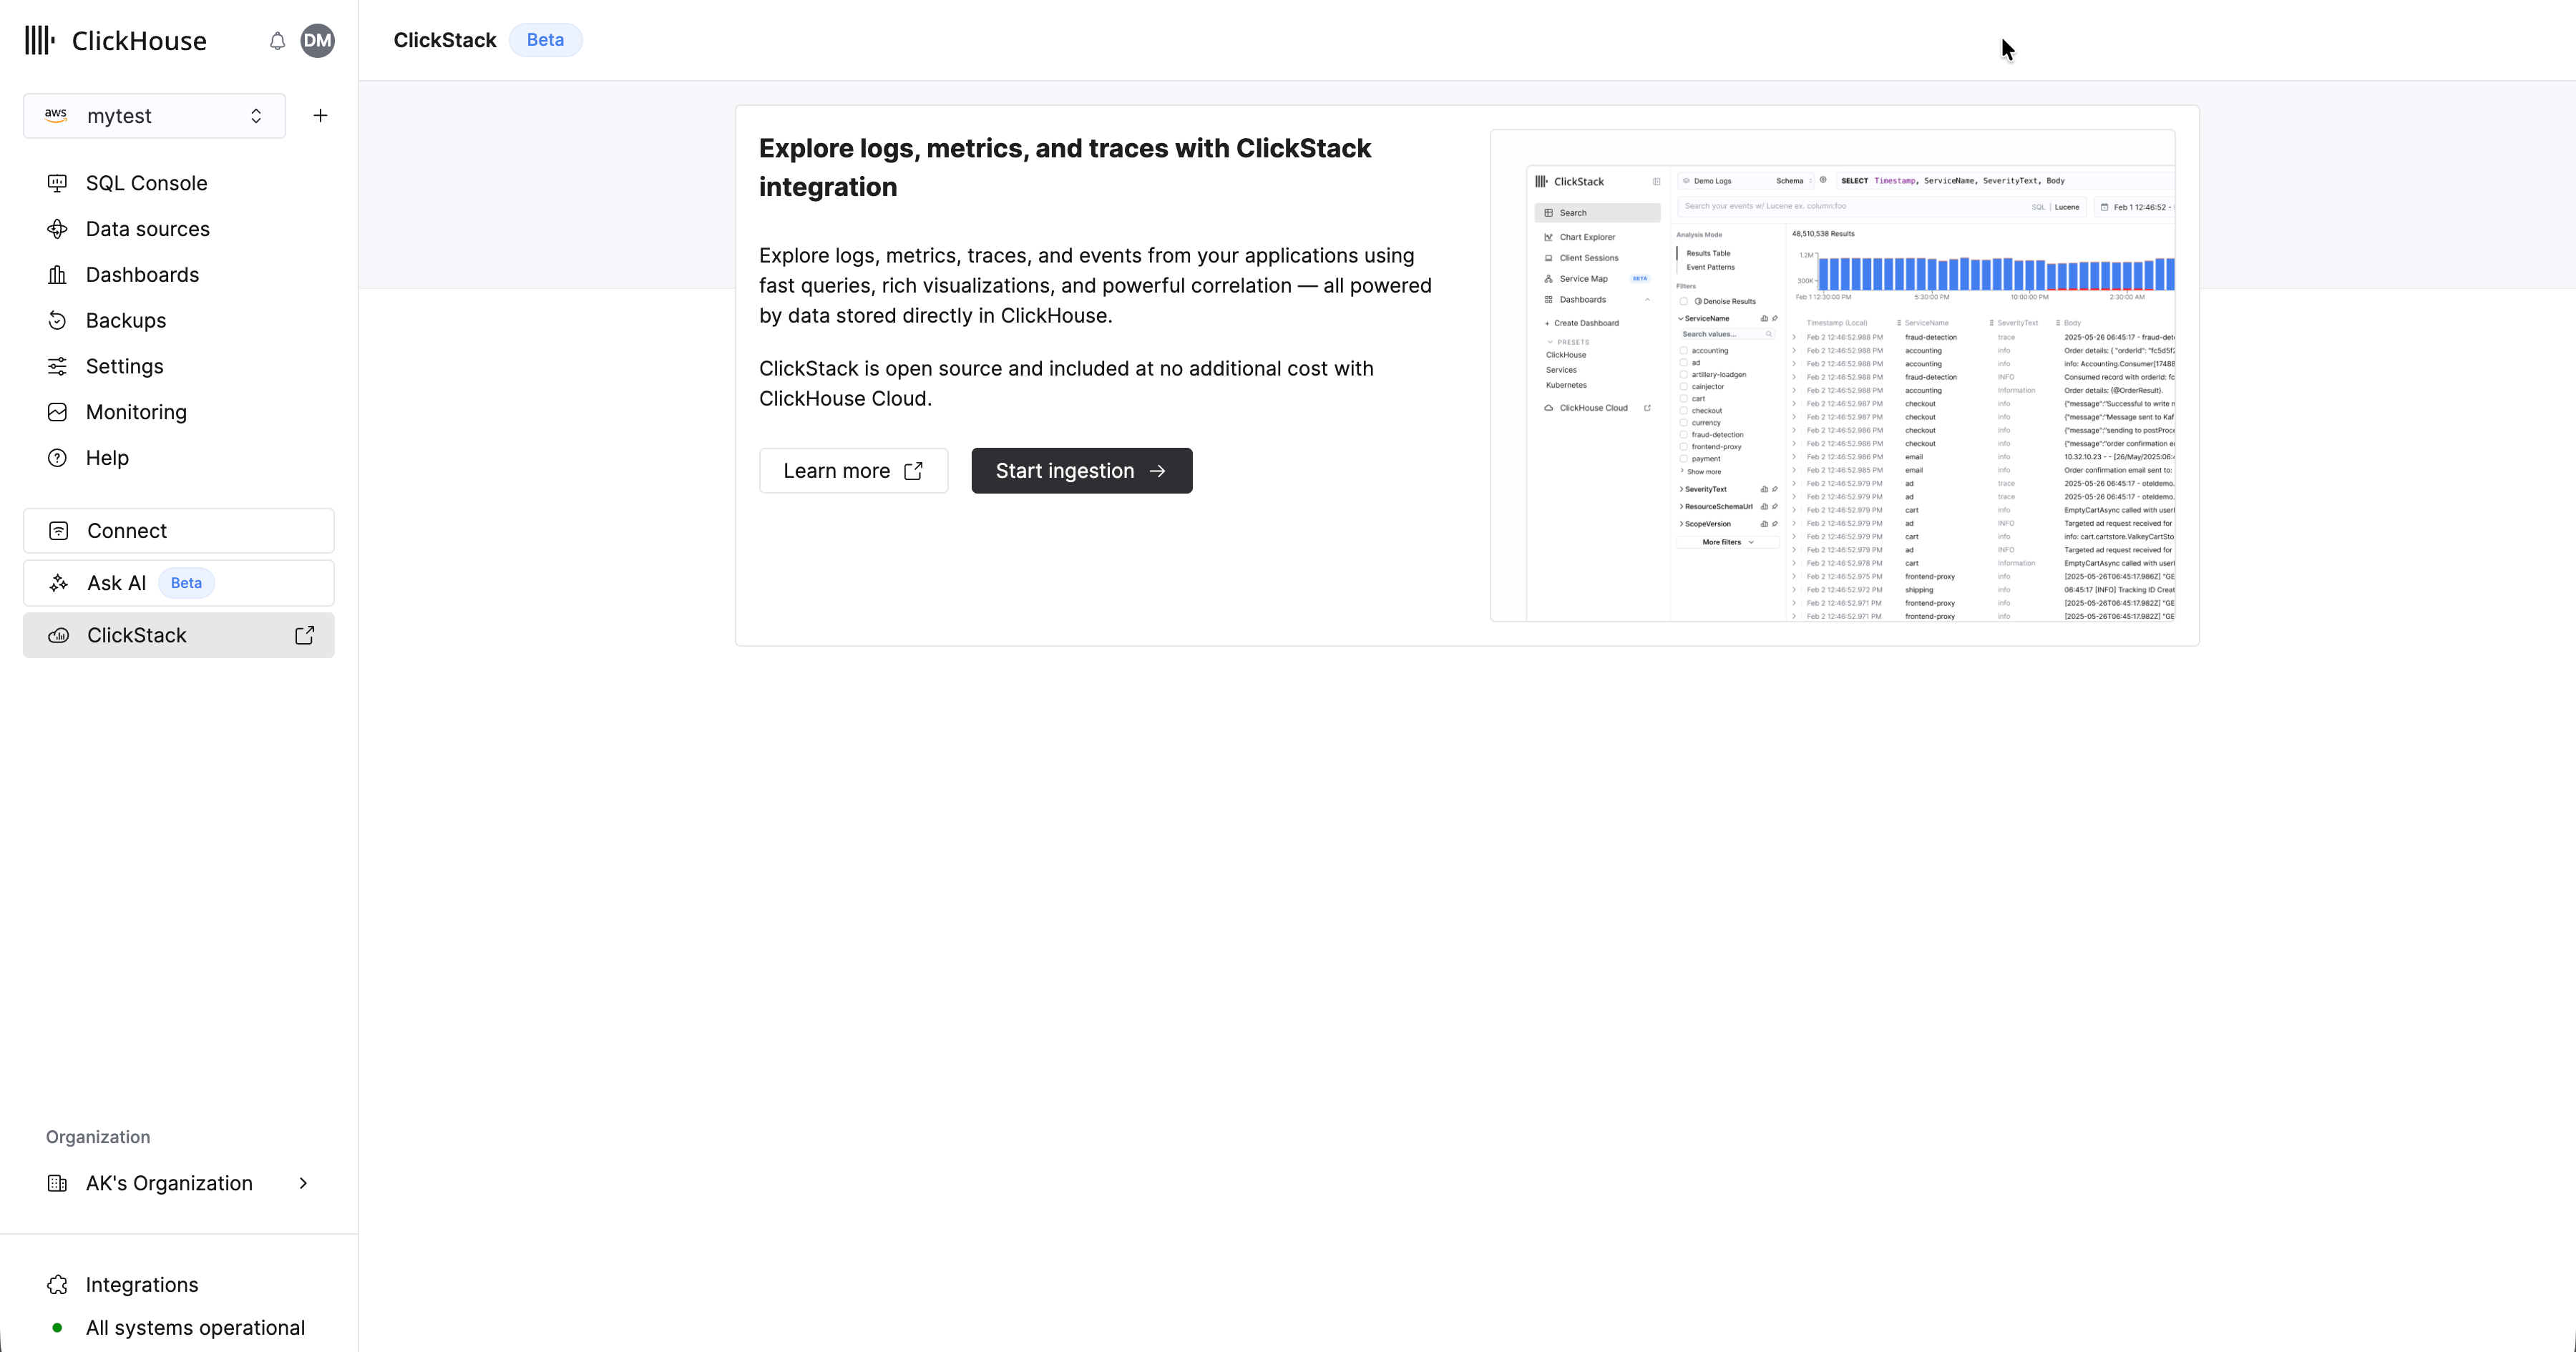 Select "Start Ingestion" and you'll be prompted to select an ingestion source. Managed ClickStack supports OpenTelemetry and [Vector](https://vector.dev/) as its main ingestion sources. However, users are also free to send data directly to ClickHouse in their own schema using any of the [ClickHouse Cloud support integrations](/integrations/home).
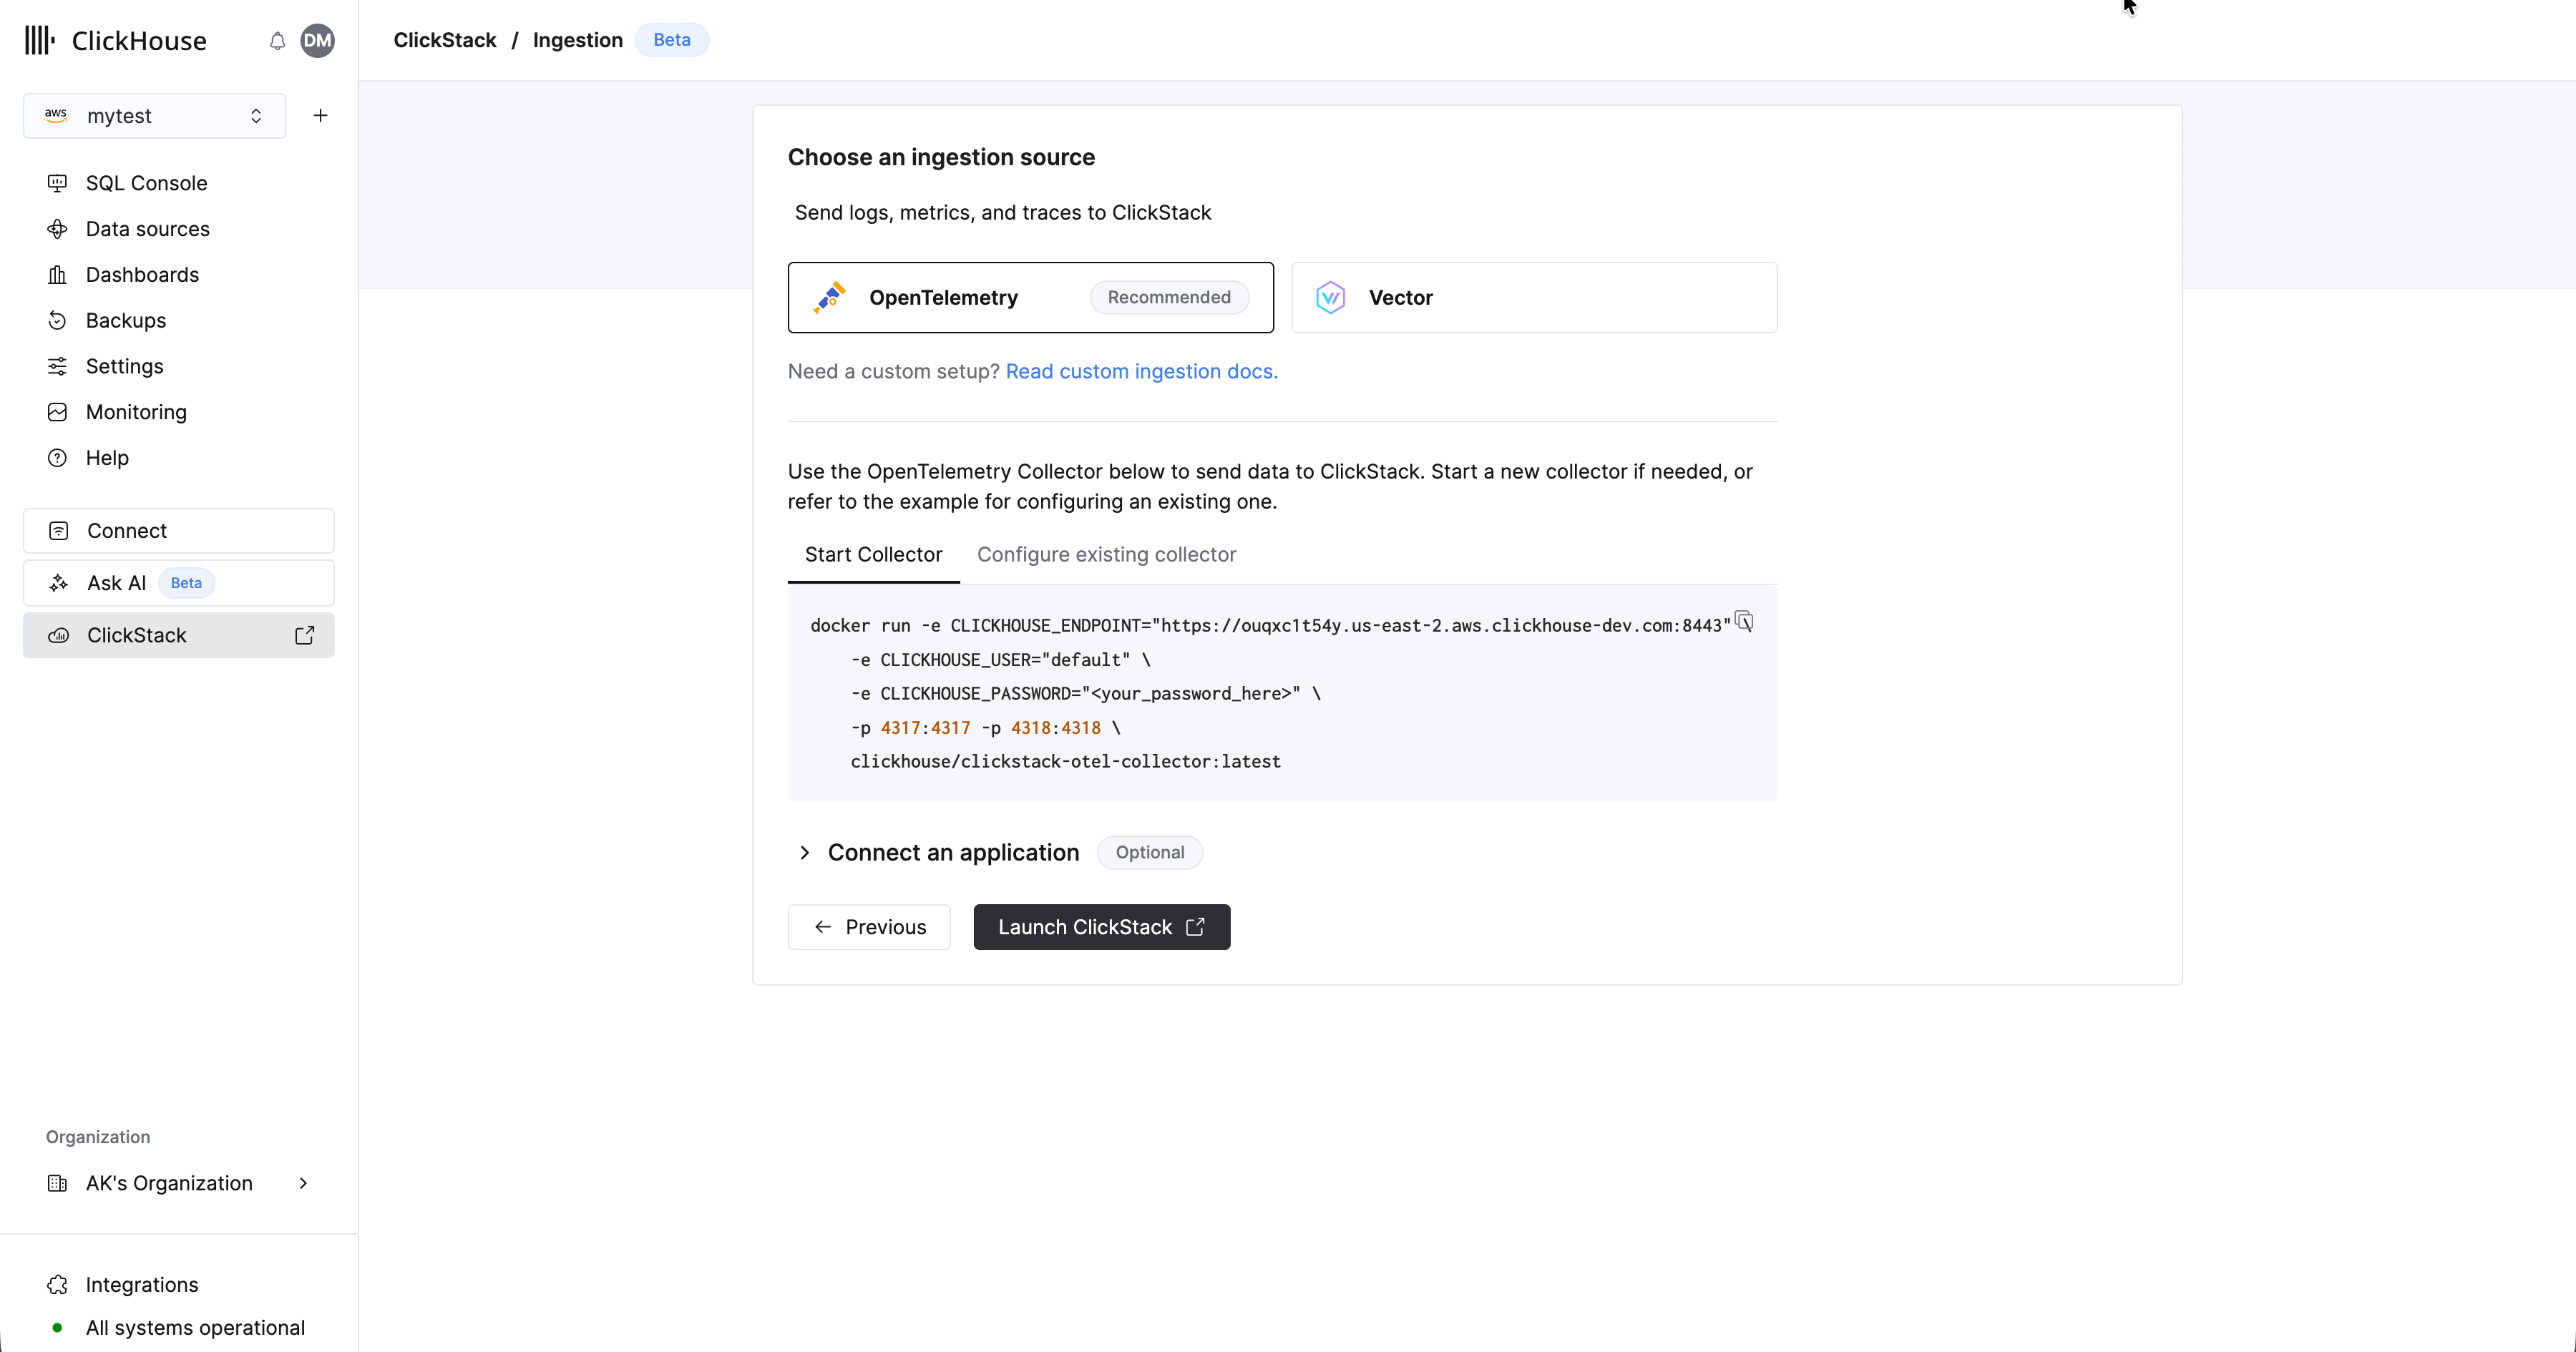 **OpenTelemetry recommended**
Use of the OpenTelemetry is strongly recommended as the ingestion format.
It provides the simplest and most optimized experience, with out-of-the-box schemas that are specifically designed to work efficiently with ClickStack.
To send OpenTelemetry data to Managed ClickStack, you're recommended to use an OpenTelemetry Collector. The collector acts as a gateway that receives OpenTelemetry data from your applications (and other collectors) and forwards it to ClickHouse Cloud.
If you don't already have one running, start a collector using the steps below. If you have existing collectors, a configuration example is also provided.
### Start a collector
The following assumes the recommended path of using the **ClickStack distribution of the OpenTelemetry Collector**, which includes additional processing and is optimized specifically for ClickHouse Cloud. If you're looking to use your own OpenTelemetry Collector, see ["Configure existing collectors."](#configure-existing-collectors)
To get started quickly, copy and run the Docker command shown.
**OpenTelemetry recommended**
Use of the OpenTelemetry is strongly recommended as the ingestion format.
It provides the simplest and most optimized experience, with out-of-the-box schemas that are specifically designed to work efficiently with ClickStack.
To send OpenTelemetry data to Managed ClickStack, you're recommended to use an OpenTelemetry Collector. The collector acts as a gateway that receives OpenTelemetry data from your applications (and other collectors) and forwards it to ClickHouse Cloud.
If you don't already have one running, start a collector using the steps below. If you have existing collectors, a configuration example is also provided.
### Start a collector
The following assumes the recommended path of using the **ClickStack distribution of the OpenTelemetry Collector**, which includes additional processing and is optimized specifically for ClickHouse Cloud. If you're looking to use your own OpenTelemetry Collector, see ["Configure existing collectors."](#configure-existing-collectors)
To get started quickly, copy and run the Docker command shown.
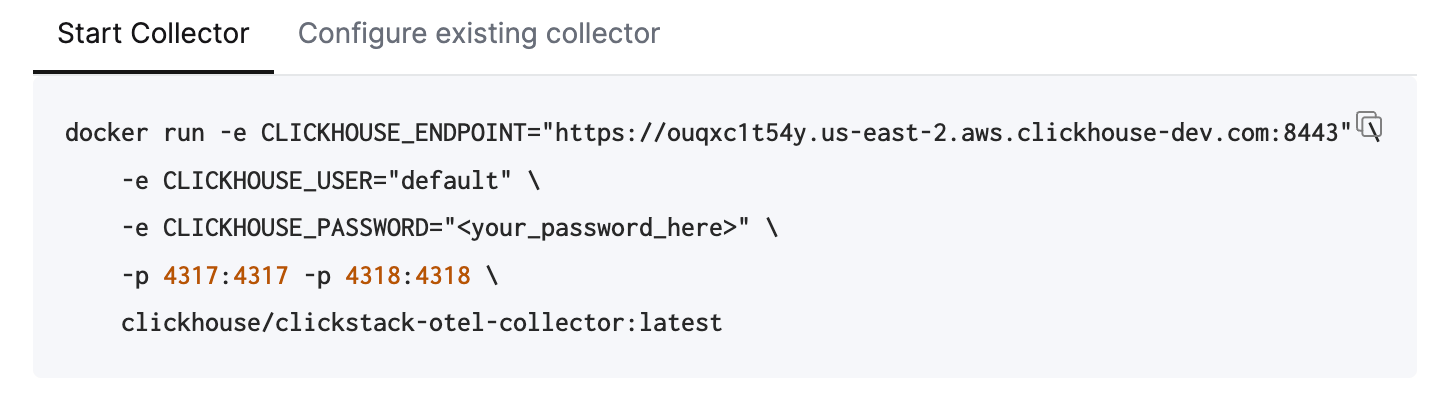 This command should include your connection credentials pre-populated.
**Deploying to production**
While this command uses the `default` user to connect Managed ClickStack, you should create a dedicated user when [going to production](/clickstack/managing/overview#create-a-database-ingestion-user-managed) and modifying your configuration.
Running this single command starts the ClickStack collector with OTLP endpoints exposed on ports 4317 (gRPC) and 4318 (HTTP). If you already have OpenTelemetry instrumentation and agents, you can immediately begin sending telemetry data to these endpoints.
### Configure existing collectors
It's also possible to configure your own existing OpenTelemetry Collectors or use your own distribution of the collector.
**ClickHouse exporter required**
If you're using your own distribution, for example the [contrib image](https://github.com/open-telemetry/opentelemetry-collector-contrib), ensure that it includes the [ClickHouse exporter](https://github.com/open-telemetry/opentelemetry-collector-contrib/tree/main/exporter/clickhouseexporter).
For this purpose, you're provided with an example OpenTelemetry Collector configuration that uses the ClickHouse exporter with appropriate settings and exposes OTLP receivers. This configuration matches the interfaces and behavior expected by the ClickStack distribution.
For further details on configuring OpenTelemetry collectors, see ["Ingesting with OpenTelemetry."](/clickstack/ingesting-data/opentelemetry)
### Start ingestion (optional)
If you have existing applications or infrastructure to instrument with OpenTelemetry, navigate to the relevant guides linked from the UI.
To instrument your applications to collect traces and logs, use the [supported language SDKs](/clickstack/ingesting-data/sdks) which send data to your OpenTelemetry Collector acting as a gateway for ingestion into Managed ClickStack.
Logs can be [collected using OpenTelemetry Collectors](/clickstack/integration-examples/host-logs) running in agent mode, forwarding data to the same collector. For Kubernetes monitoring, follow the [dedicated guide](/clickstack/integration-examples/kubernetes). For other integrations, see our [quickstart guides](/clickstack/integration-examples).
### Demo data
Alternatively, if you don't have existing data, try one of our sample datasets.
* [Example dataset](/clickstack/example-datasets/sample-data) - Load an example dataset from our public demo. Diagnose a simple issue.
* [Local files and metrics](/clickstack/example-datasets/local-data) - Load local files and monitor the system on OSX or Linux using a local OTel collector.
This command should include your connection credentials pre-populated.
**Deploying to production**
While this command uses the `default` user to connect Managed ClickStack, you should create a dedicated user when [going to production](/clickstack/managing/overview#create-a-database-ingestion-user-managed) and modifying your configuration.
Running this single command starts the ClickStack collector with OTLP endpoints exposed on ports 4317 (gRPC) and 4318 (HTTP). If you already have OpenTelemetry instrumentation and agents, you can immediately begin sending telemetry data to these endpoints.
### Configure existing collectors
It's also possible to configure your own existing OpenTelemetry Collectors or use your own distribution of the collector.
**ClickHouse exporter required**
If you're using your own distribution, for example the [contrib image](https://github.com/open-telemetry/opentelemetry-collector-contrib), ensure that it includes the [ClickHouse exporter](https://github.com/open-telemetry/opentelemetry-collector-contrib/tree/main/exporter/clickhouseexporter).
For this purpose, you're provided with an example OpenTelemetry Collector configuration that uses the ClickHouse exporter with appropriate settings and exposes OTLP receivers. This configuration matches the interfaces and behavior expected by the ClickStack distribution.
For further details on configuring OpenTelemetry collectors, see ["Ingesting with OpenTelemetry."](/clickstack/ingesting-data/opentelemetry)
### Start ingestion (optional)
If you have existing applications or infrastructure to instrument with OpenTelemetry, navigate to the relevant guides linked from the UI.
To instrument your applications to collect traces and logs, use the [supported language SDKs](/clickstack/ingesting-data/sdks) which send data to your OpenTelemetry Collector acting as a gateway for ingestion into Managed ClickStack.
Logs can be [collected using OpenTelemetry Collectors](/clickstack/integration-examples/host-logs) running in agent mode, forwarding data to the same collector. For Kubernetes monitoring, follow the [dedicated guide](/clickstack/integration-examples/kubernetes). For other integrations, see our [quickstart guides](/clickstack/integration-examples).
### Demo data
Alternatively, if you don't have existing data, try one of our sample datasets.
* [Example dataset](/clickstack/example-datasets/sample-data) - Load an example dataset from our public demo. Diagnose a simple issue.
* [Local files and metrics](/clickstack/example-datasets/local-data) - Load local files and monitor the system on OSX or Linux using a local OTel collector.
[Vector](https://vector.dev) is a high-performance, vendor-neutral observability data pipeline, especially popular for log ingestion due to its flexibility and low resource footprint.
When using Vector with ClickStack, users are responsible for defining their own schemas. These schemas may follow OpenTelemetry conventions, but they can also be entirely custom, representing user-defined event structures.
**Timestamp required**
The only strict requirement for Managed ClickStack, is that the data includes a **timestamp column** (or equivalent time field), which can be declared when configuring the data source in the ClickStack UI.
The following assumes you have an instance of Vector running, pre-configured with ingest pipelines, delivering data.
### Create a database and table
Vector requires a table and schema to be defined prior to data ingestion.
First create a database. This can be done via the [ClickHouse Cloud console](/products/cloud/features/sql-console-features/sql-console).
For example, create a database for logs:
```sql theme={null}
CREATE DATABASE IF NOT EXISTS logs
```
Then create a table whose schema matches the structure of your log data. The example below assumes a classic Nginx access log format:
```sql theme={null}
CREATE TABLE logs.nginx_logs
(
`time_local` DateTime,
`remote_addr` IPv4,
`remote_user` LowCardinality(String),
`request` String,
`status` UInt16,
`body_bytes_sent` UInt64,
`http_referer` String,
`http_user_agent` String,
`http_x_forwarded_for` LowCardinality(String),
`request_time` Float32,
`upstream_response_time` Float32,
`http_host` String
)
ENGINE = MergeTree
ORDER BY (toStartOfMinute(time_local), status, remote_addr);
```
Your table must align with the output schema produced by Vector. Adjust the schema as needed for your data, following the recommended [schema best practices](/concepts/best-practices/select-data-type).
We strongly recommend understanding how [Primary keys](/concepts/core-concepts/primary-indexes) work in ClickHouse and choosing an ordering key based on your access patterns. See the [ClickStack-specific](/clickstack/managing/performance-tuning#choosing-a-primary-key) guidance on choosing a primary key.
Once the table exists, copy the configuration snippet shown. Adjust the input to consume your existing pipelines, as well as the target table and database if required. Credentials should be pre-populated.
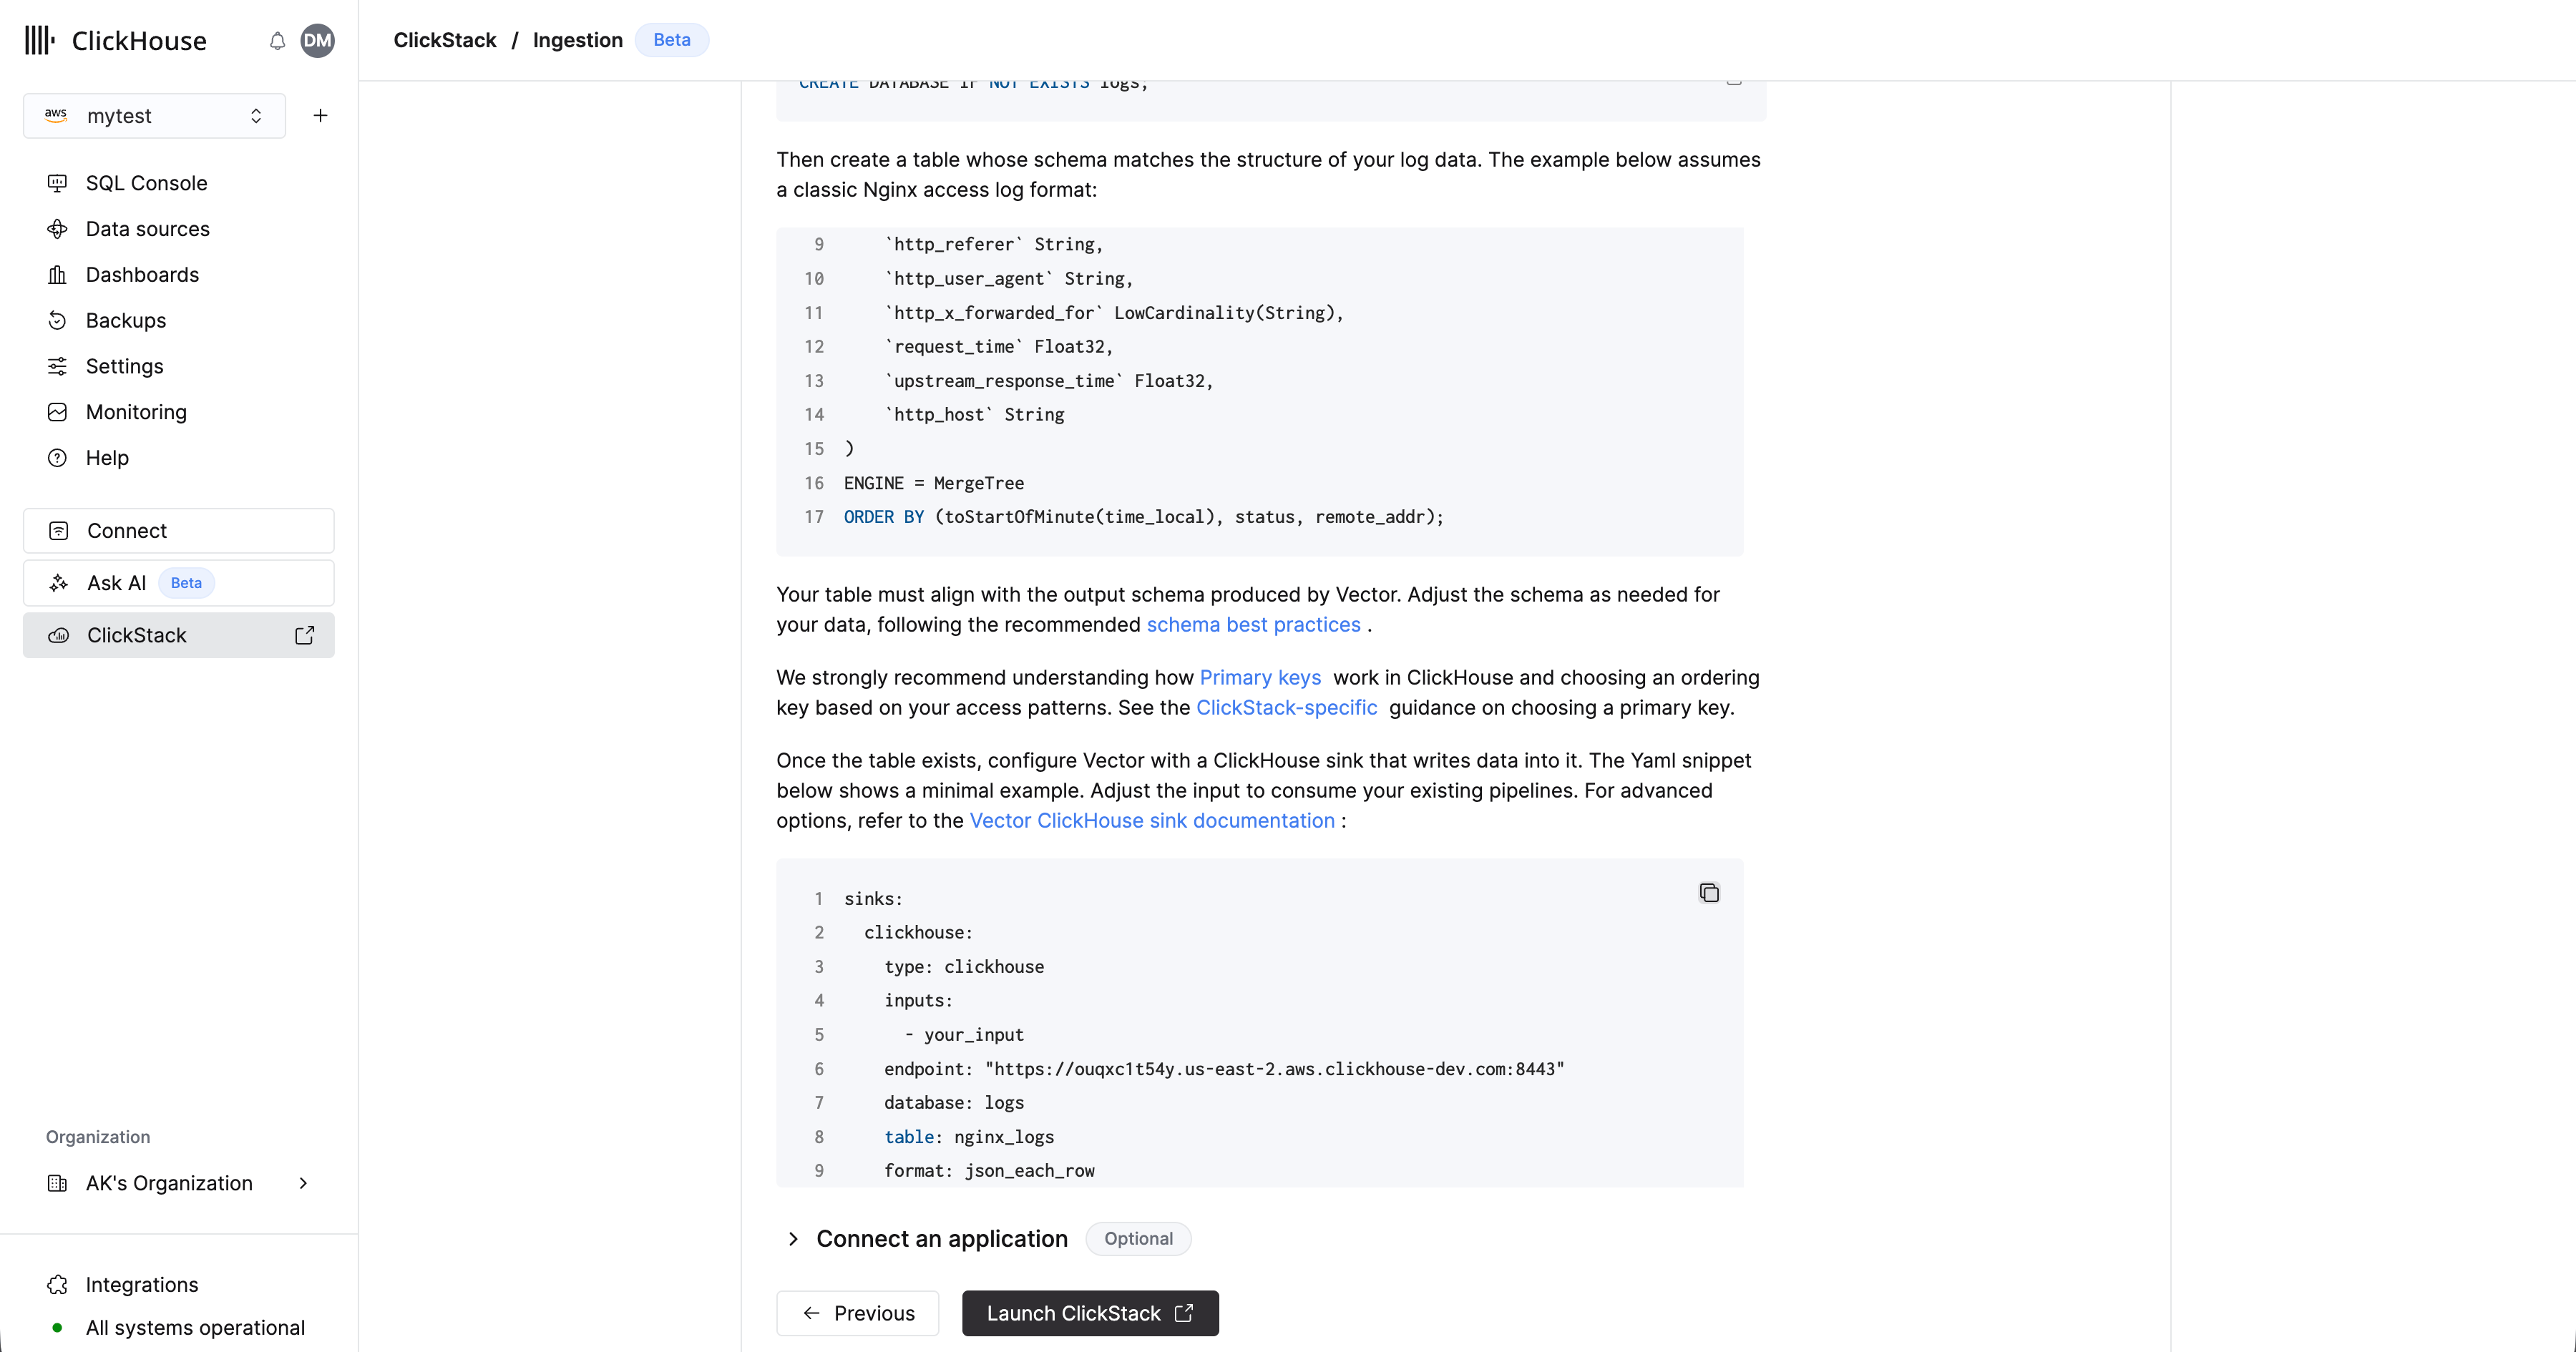 For more examples of ingesting data with Vector, see ["Ingesting with Vector"](/clickstack/ingesting-data/vector) or the [Vector ClickHouse sink documentation](https://vector.dev/docs/reference/configuration/sinks/clickhouse/) for advanced options.
Navigate to the ClickStack UI
Select 'Launch ClickStack' to access the ClickStack UI (HyperDX). You will automatically authenticated and redirected.
Data sources will be pre-created for any OpenTelemetry data.
 If you're using Vector, you will need to create your own data sources. You will be prompted to create one on your first login. Below we show an example configuration for a logs data source.
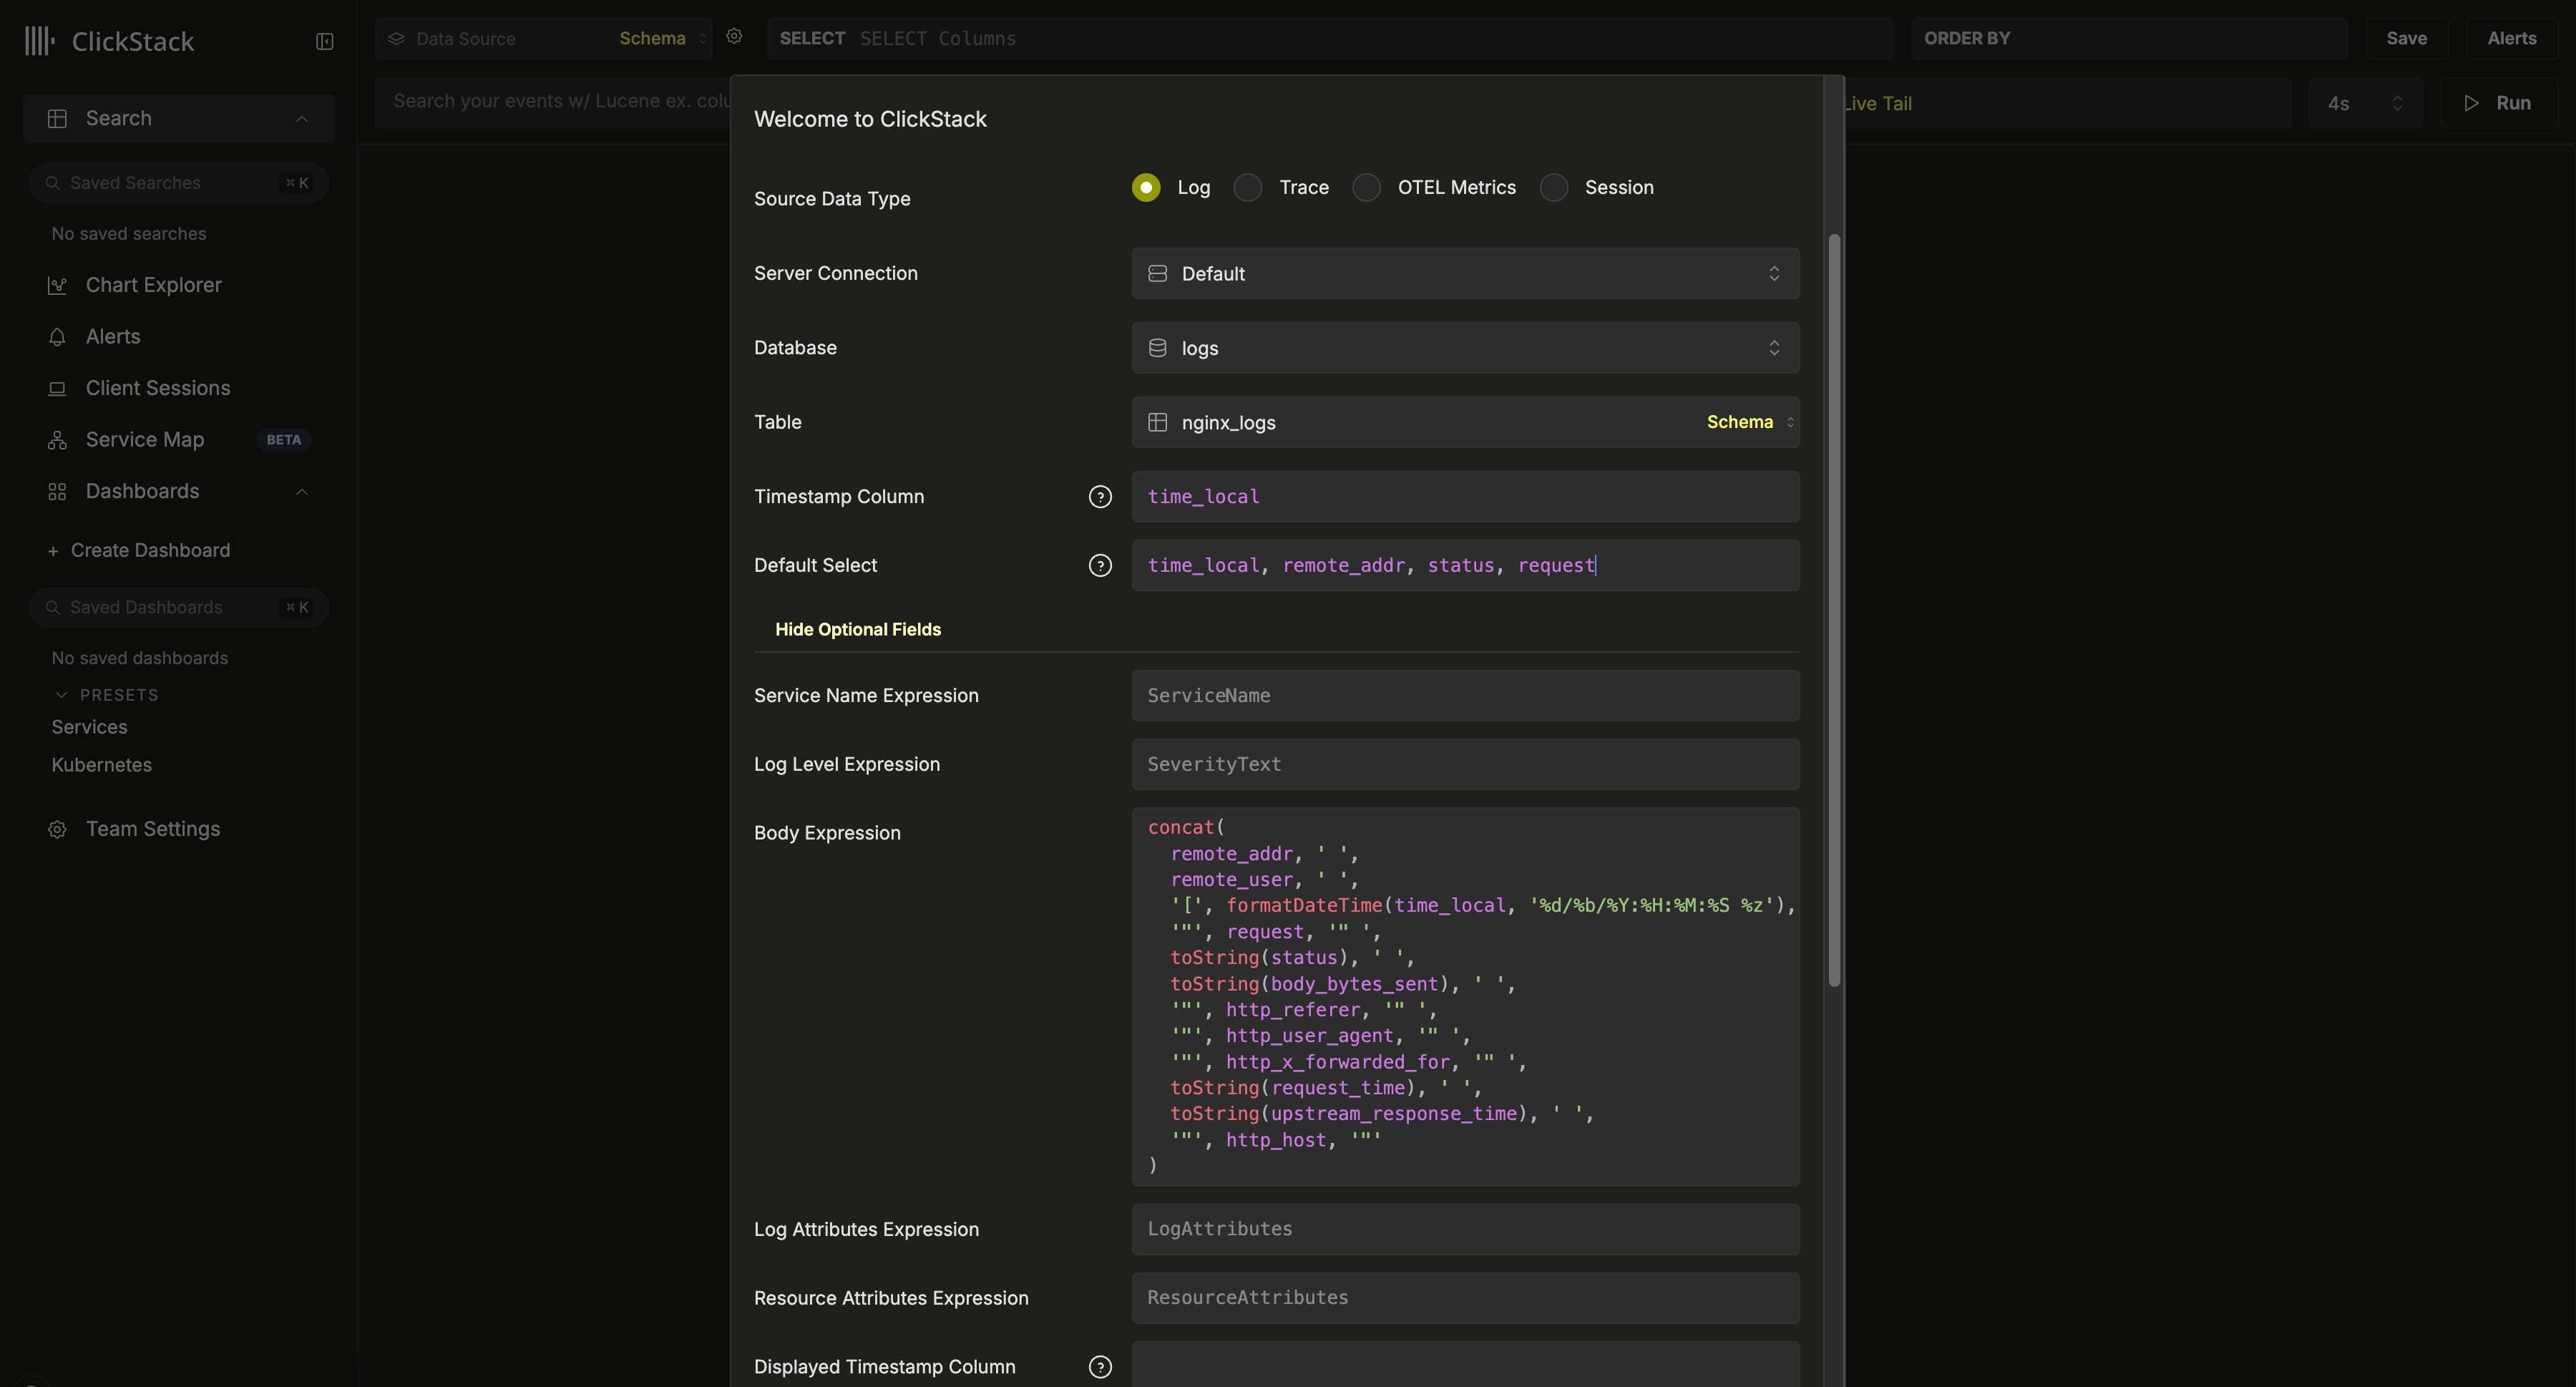 This configuration assumes an Nginx-style schema with a `time_local` column used as the timestamp. This should be, where possible, the timestamp column declared in the primary key. **This column is mandatory**.
We also recommend updating the `Default SELECT` to explicitly define which columns are returned in the logs view. If additional fields are available, such as service name, log level, or a body column, these can also be configured. The timestamp display column can also be overridden if it differs from the column used in the table's primary key and configured above.
In the example above, a `Body` column doesn't exist in the data. Instead, it is defined using a SQL expression that reconstructs an Nginx log line from the available fields.
For other possible options, see the [configuration reference](/clickstack/managing/config).
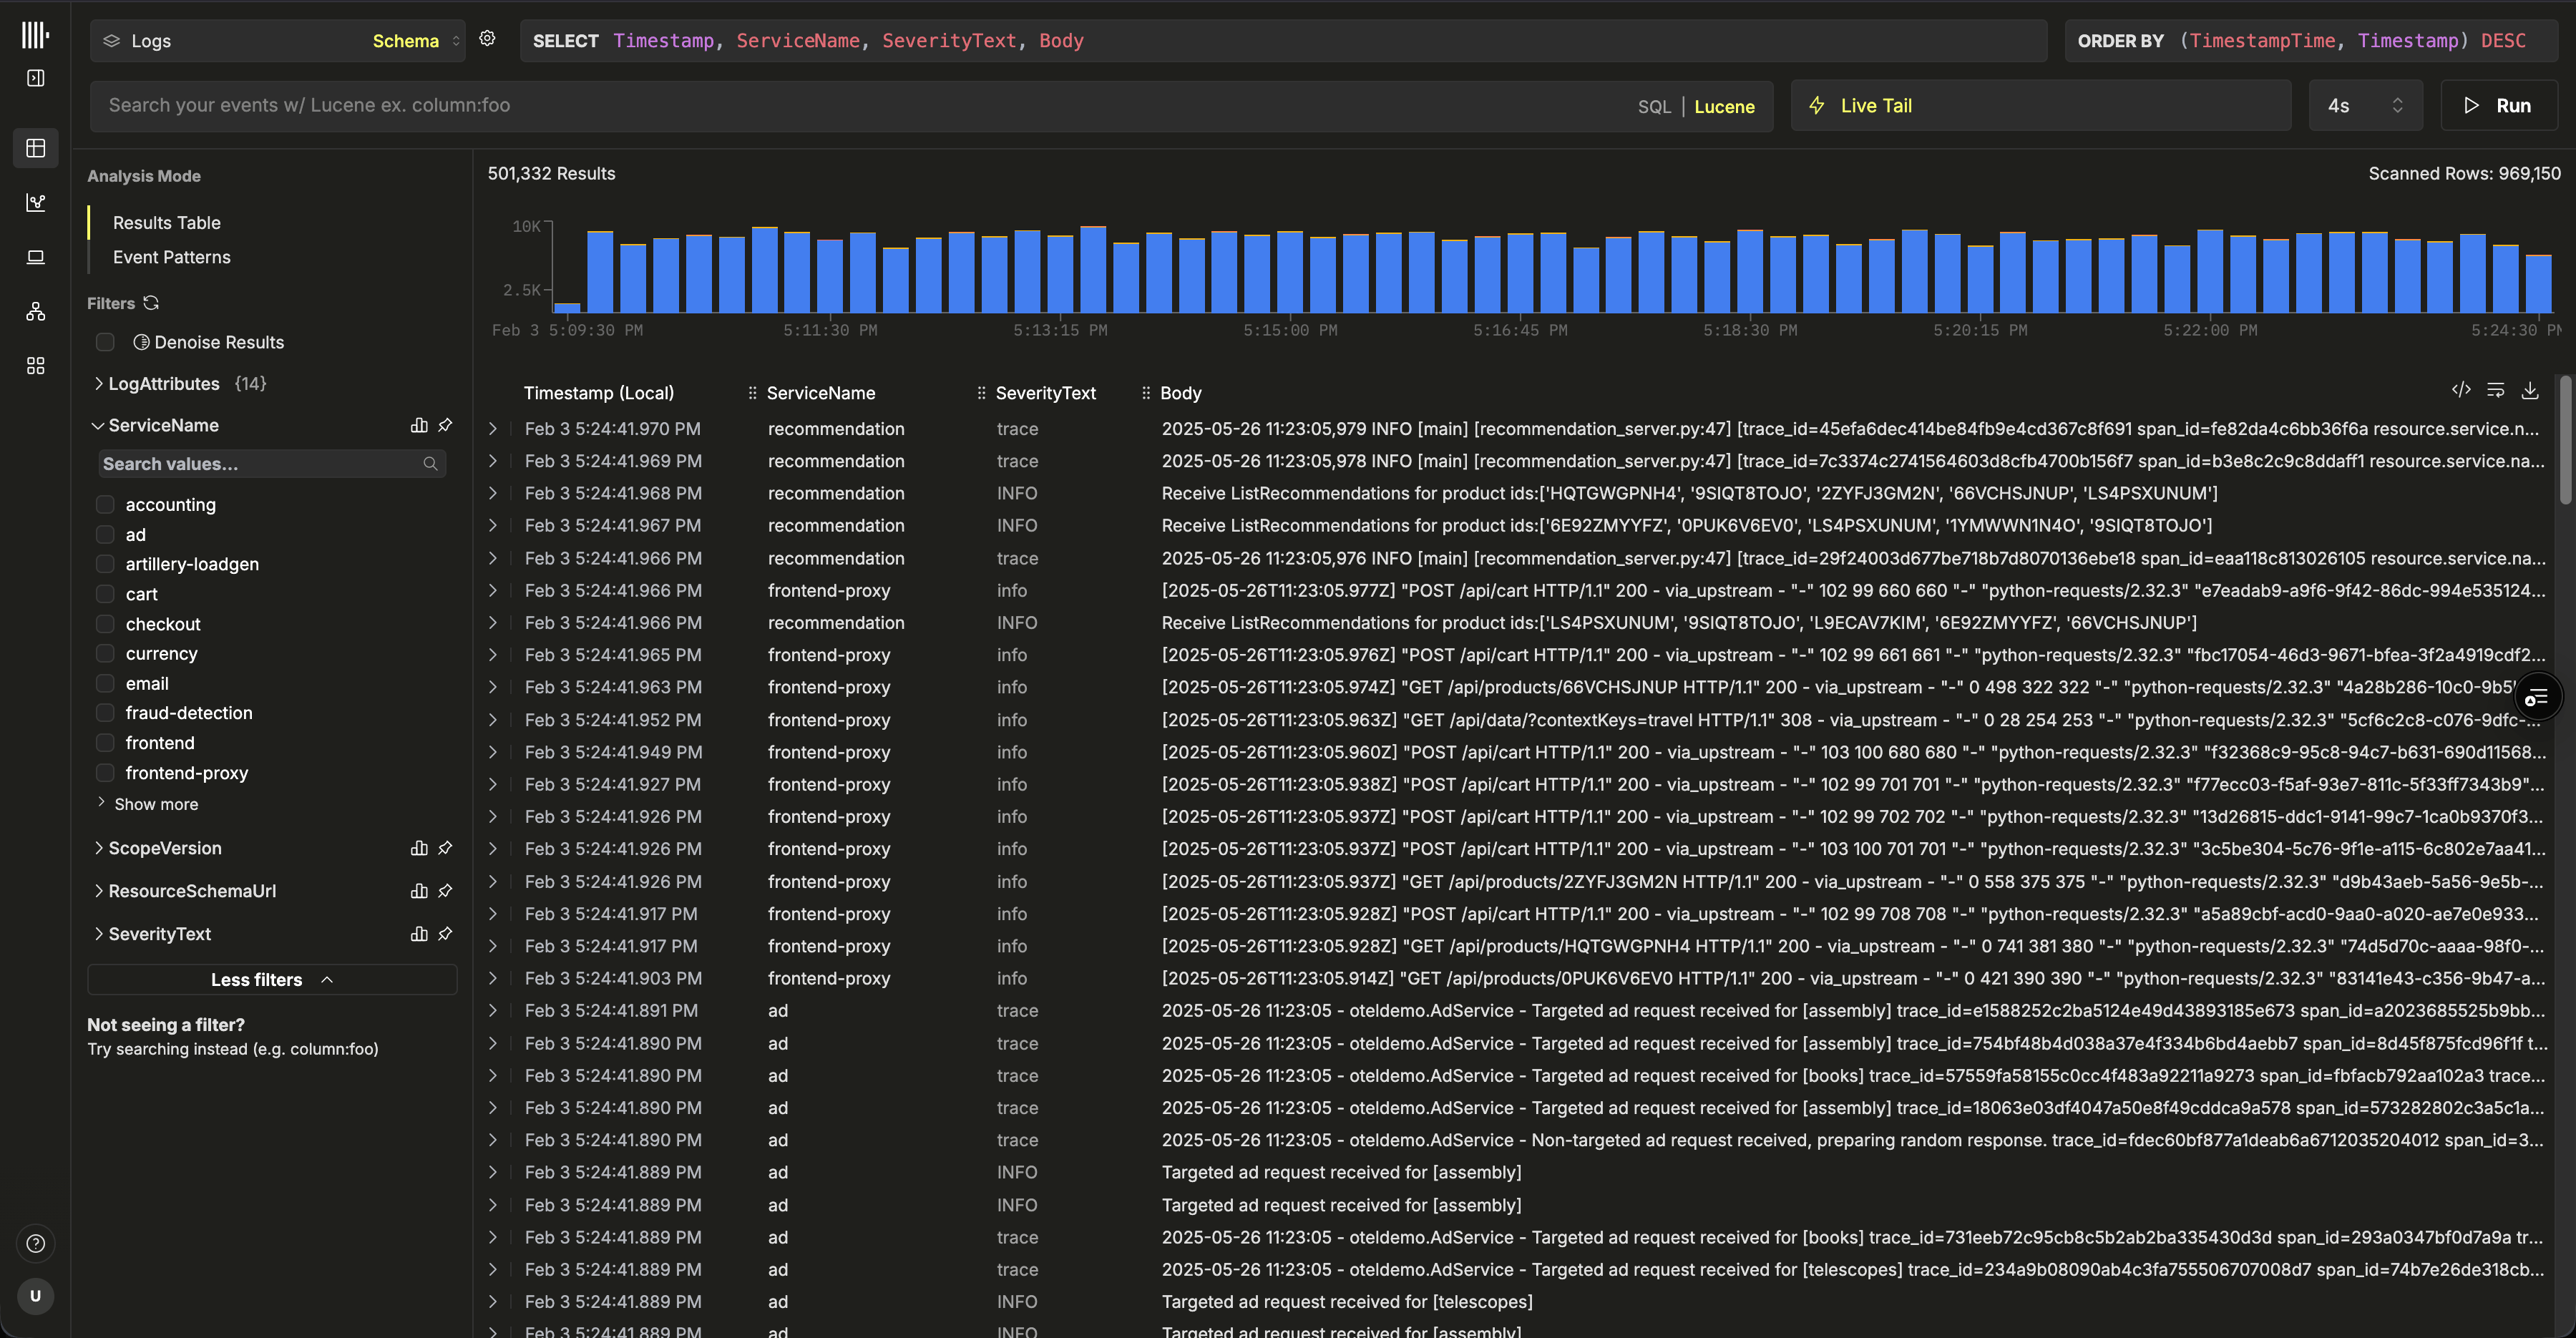
Once created, you should be directed to the search view where you can immediately begin exploring your data.
This configuration assumes an Nginx-style schema with a `time_local` column used as the timestamp. This should be, where possible, the timestamp column declared in the primary key. **This column is mandatory**.
We also recommend updating the `Default SELECT` to explicitly define which columns are returned in the logs view. If additional fields are available, such as service name, log level, or a body column, these can also be configured. The timestamp display column can also be overridden if it differs from the column used in the table's primary key and configured above.
In the example above, a `Body` column doesn't exist in the data. Instead, it is defined using a SQL expression that reconstructs an Nginx log line from the available fields.
For other possible options, see the [configuration reference](/clickstack/managing/config).
Once created, you should be directed to the search view where you can immediately begin exploring your data.
And that’s it — you’re all set. 🎉
Go ahead and explore ClickStack: start searching logs and traces, see how logs, traces, and metrics correlate in real time, build dashboards, explore service maps, uncover event deltas and patterns, and set up alerts to stay ahead of issues.
Select a service
From the ClickHouse Cloud landing page, select the service for which you wish to enable managed ClickStack.
**Estimating resources**
This guide assumes you have provisioned sufficient resources to handle the volume of observability data you plan to ingest and query with ClickStack. To estimate the required resources, refer to the [Estimating Resources](/clickstack/managing/estimating-resources) guide.
If your ClickHouse service already hosts existing workloads, such as real-time application analytics, we recommend creating a child service using [ClickHouse Cloud's warehouses feature](/products/cloud/features/infrastructure/warehouses) to isolate the observability workload. This ensures your existing applications aren't disrupted, while keeping the datasets accessible from both services.
Navigate to the ClickStack UI
Select 'ClickStack' from the left navigation menu. You will be redirected to the ClickStack UI and automatically authenticated based on your ClickHouse Cloud permissions.
If any OpenTelemetry tables exist already in your service, these will be auto-detected, and corresponding data sources created.
**Auto-detection of datasources**
Auto-detection relies on the standard OpenTelemetry table schema provided by the ClickStack distribution of the OpenTelemetry collector. Sources are created for the database with the most complete set of tables. Additional tables can be added as [separate data sources](/clickstack/managing/config#datasource-settings) if needed.
If auto detection is successful, you should be directed to the search view where you can immediately begin exploring your data.
If this step is successful, that that's it — you’re all set 🎉, otherwise proceed to setting up ingestion.
Setup ingestion
If auto-detection fails, or you have no existing tables, you will be prompted to set up ingestion.
Select "Start Ingestion" and you'll be prompted to select an ingestion source. Managed ClickStack supports OpenTelemetry and [Vector](https://vector.dev/) as its main ingestion sources. However, users are also free to send data directly to ClickHouse in their own schema using any of the [ClickHouse Cloud support integrations](/integrations/home).
**OpenTelemetry recommended**
Use of the OpenTelemetry is strongly recommended as the ingestion format.
It provides the simplest and most optimized experience, with out-of-the-box schemas that are specifically designed to work efficiently with ClickStack.
To send OpenTelemetry data to Managed ClickStack, you're recommended to use an OpenTelemetry Collector. The collector acts as a gateway that receives OpenTelemetry data from your applications (and other collectors) and forwards it to ClickHouse Cloud.
If you don't already have one running, start a collector using the steps below. If you have existing collectors, a configuration example is also provided.
Start a collector
The following assumes the recommended path of using the **ClickStack distribution of the OpenTelemetry Collector**, which includes additional processing and is optimized specifically for ClickHouse Cloud. If you're looking to use your own OpenTelemetry Collector, see ["Configure existing collectors."](#configure-existing-collectors)
To get started quickly, copy and run the Docker command shown.
**Modify this command with your service credentials, recorded when you created your service.**
**Deploying to production**
While this command uses the `default` user to connect Managed ClickStack, you should create a dedicated user when [going to production](/clickstack/managing/production#create-a-database-ingestion-user-managed) and modifying your configuration.
Running this single command starts the ClickStack collector with OTLP endpoints exposed on ports 4317 (gRPC) and 4318 (HTTP). If you already have OpenTelemetry instrumentation and agents, you can immediately begin sending telemetry data to these endpoints.
It's also possible to configure your own existing OpenTelemetry Collectors or use your own distribution of the collector.
**ClickHouse exporter required**
If you're using your own distribution, for example the [contrib image](https://github.com/open-telemetry/opentelemetry-collector-contrib), ensure that it includes the [ClickHouse exporter](https://github.com/open-telemetry/opentelemetry-collector-contrib/tree/main/exporter/clickhouseexporter).
For this purpose, you're provided with an example OpenTelemetry Collector configuration that uses the ClickHouse exporter with appropriate settings and exposes OTLP receivers. This configuration matches the interfaces and behavior expected by the ClickStack distribution.
An example of this configuration is shown below (environment variables will be pre-populated if copying from the UI):
```yaml theme={null}
receivers:
otlp/hyperdx:
protocols:
grpc:
include_metadata: true
endpoint: "0.0.0.0:4317"
http:
cors:
allowed_origins: ["*"]
allowed_headers: ["*"]
include_metadata: true
endpoint: "0.0.0.0:4318"
processors:
batch:
memory_limiter:
# 80% of maximum memory up to 2G, adjust for low memory environments
limit_mib: 1500
# 25% of limit up to 2G, adjust for low memory environments
spike_limit_mib: 512
check_interval: 5s
connectors:
routing/logs:
default_pipelines: [logs/out-default]
error_mode: ignore
table:
- context: log
statement: route() where IsMatch(attributes["rr-web.event"], ".*")
pipelines: [logs/out-rrweb]
exporters:
debug:
verbosity: detailed
sampling_initial: 5
sampling_thereafter: 200
clickhouse/rrweb:
database: default
endpoint:
password:
username: default
ttl: 720h
logs_table_name: hyperdx_sessions
timeout: 5s
retry_on_failure:
enabled: true
initial_interval: 5s
max_interval: 30s
max_elapsed_time: 300s
clickhouse:
database: default
endpoint:
password:
username: default
ttl: 720h
timeout: 5s
retry_on_failure:
enabled: true
initial_interval: 5s
max_interval: 30s
max_elapsed_time: 300s
service:
pipelines:
traces:
receivers: [otlp/hyperdx]
processors: [memory_limiter, batch]
exporters: [clickhouse]
metrics:
receivers: [otlp/hyperdx]
processors: [memory_limiter, batch]
exporters: [clickhouse]
logs/in:
receivers: [otlp/hyperdx]
exporters: [routing/logs]
logs/out-default:
receivers: [routing/logs]
processors: [memory_limiter, batch]
exporters: [clickhouse]
logs/out-rrweb:
receivers: [routing/logs]
processors: [memory_limiter, batch]
exporters: [clickhouse/rrweb]
```
For further details on configuring OpenTelemetry collectors, see ["Ingesting with OpenTelemetry."](/clickstack/ingesting-data/opentelemetry)
Start ingestion (optional)
If you have existing applications or infrastructure to instrument with OpenTelemetry, navigate to the relevant guides linked from "Connect an application".
To instrument your applications to collect traces and logs, use the [supported language SDKs](/clickstack/ingesting-data/sdks) which send data to your OpenTelemetry Collector acting as a gateway for ingestion into Managed ClickStack.
Logs can be [collected using OpenTelemetry Collectors](/clickstack/integration-examples/host-logs) running in agent mode, forwarding data to the same collector. For Kubernetes monitoring, follow the [dedicated guide](/clickstack/integration-examples/kubernetes). For other integrations, see our [quickstart guides](/clickstack/integration-examples).
[Vector](https://vector.dev) is a high-performance, vendor-neutral observability data pipeline, especially popular for log ingestion due to its flexibility and low resource footprint.
When using Vector with ClickStack, users are responsible for defining their own schemas. These schemas may follow OpenTelemetry conventions, but they can also be entirely custom, representing user-defined event structures.
**Timestamp required**
The only strict requirement for Managed ClickStack, is that the data includes a **timestamp column** (or equivalent time field), which can be declared when configuring the data source in the ClickStack UI.
The following assumes you have an instance of Vector running, pre-configured with ingest pipelines, delivering data.
Create a database and table
Vector requires a table and schema to be defined prior to data ingestion.
First create a database. This can be done via the [ClickHouse Cloud console](/products/cloud/features/sql-console-features/sql-console).
For example, create a database for logs:
```sql theme={null}
CREATE DATABASE IF NOT EXISTS logs
```
Then create a table whose schema matches the structure of your log data. The example below assumes a classic Nginx access log format:
```sql theme={null}
CREATE TABLE logs.nginx_logs
(
`time_local` DateTime,
`remote_addr` IPv4,
`remote_user` LowCardinality(String),
`request` String,
`status` UInt16,
`body_bytes_sent` UInt64,
`http_referer` String,
`http_user_agent` String,
`http_x_forwarded_for` LowCardinality(String),
`request_time` Float32,
`upstream_response_time` Float32,
`http_host` String
)
ENGINE = MergeTree
ORDER BY (toStartOfMinute(time_local), status, remote_addr);
```
Your table must align with the output schema produced by Vector. Adjust the schema as needed for your data, following the recommended [schema best practices](/concepts/best-practices/select-data-type).
We strongly recommend understanding how [Primary keys](/concepts/core-concepts/primary-indexes) work in ClickHouse and choosing an ordering key based on your access patterns. See the [ClickStack-specific](/clickstack/managing/performance-tuning#choosing-a-primary-key) guidance on choosing a primary key.
Once the table exists, copy the configuration snippet shown. Adjust the input to consume your existing pipelines, as well as the target table and database if required. Credentials should be pre-populated.
For more examples of ingesting data with Vector, see ["Ingesting with Vector"](/clickstack/ingesting-data/vector) or the [Vector ClickHouse sink documentation](https://vector.dev/docs/reference/configuration/sinks/clickhouse/) for advanced options.
Navigate to the ClickStack UI
Once you have completed setting up ingestion and started to send data, select "Next".
If you've ingested OpenTelemetry data using this guide, data sources are created automatically and no further setup is required. You can start exploring ClickStack right away. You'll be directed to the search view with a source automatically selected so you can begin querying immediately.
That's it — you’re all set 🎉.
If you've ingested via Vector data or another source, you will be prompted to configure the data source.
The configuration above assumes an Nginx-style schema with a `time_local` column used as the timestamp. This should be, where possible, the timestamp column declared in the primary key. **This column is mandatory**.
We also recommend updating the `Default SELECT` to explicitly define which columns are returned in the logs view. If additional fields are available, such as service name, log level, or a body column, these can also be configured. The timestamp display column can also be overridden if it differs from the column used in the table's primary key and configured above.
In the example above, a `Body` column doesn't exist in the data. Instead, it is defined using a SQL expression that reconstructs an Nginx log line from the available fields.
For other possible options, see the [configuration reference](/clickstack/managing/config#hyperdx).
Once the source is configured, click "Save" and begin exploring your data.
Additional tasks
1. Navigate to your service in the ClickHouse Cloud console
2. Go to **Settings** → **SQL Console Access**
3. Set the appropriate permission level for each user:
* **Service Admin → Full Access** - Required for enabling alerts
* **Service Read Only → Read Only** - Can view observability data and create dashboards
* **No access** - Can't access HyperDX
**Alerts require admin access**
To enable alerts, at least one user with **Service Admin** permissions (mapped to **Full Access** in the SQL Console Access dropdown) must log into HyperDX at least once. This provisions a dedicated user in the database that runs alert queries.
Using ClickStack with read-only compute
The ClickStack UI can run entirely on a read-only ClickHouse Cloud service. This is the recommended setup when you want to isolate ingestion and query workloads.
How ClickStack selects compute
ClickStack UI always connects to the ClickHouse service from where it is launched in the ClickHouse Cloud console.
This means:
* If you open ClickStack from a read-only service, all queries issued by ClickStack UI will run on that read-only compute.
* If you open ClickStack from a read-write service, ClickStack will use that compute instead.
No additional configuration inside ClickStack is required to enforce read-only behavior.
Recommended setup
To run ClickStack on read-only compute:
1. Create or identify a ClickHouse Cloud service in the warehouse configured as read-only.
2. In the ClickHouse Cloud console, select the read-only service.
3. Launch ClickStack from the left navigation menu.
Once launched, ClickStack UI will automatically bind to this read-only service.
Adding more data sources
ClickStack is OpenTelemetry native but not OpenTelemetry exclusive - you can use your own table schemas if desired.
The following describes how users can add additional data sources beyond those that are configured automatically.
Using OpenTelemetry schemas
If you're using an OTel collector to create the database and tables within ClickHouse, retain all default values within the create source model, completing the `Table` field with the value `otel_logs` - to create a logs source. All other settings should be auto-detected, allowing you to click `Save New Source`.
To create sources for traces and OTel metrics, you can select `Create New Source` from the top menu.
From here, select the required source type followed by the appropriate table e.g. for traces, select the table `otel_traces`. All settings should be auto-detected.
**Correlating sources**
Note that different data sources in ClickStack—such as logs and traces—can be correlated with each other. To enable this, additional configuration is required on each source. For example, in the logs source, you can specify a corresponding trace source, and vice versa in the traces source. See ["Correlated sources"](/clickstack/managing/config#correlated-sources) for further details.
Using custom schemas
Users looking to connect ClickStack to an existing service with data can complete the database and table settings as required. Settings will be auto-detected if tables conform to the OpenTelemetry schemas for ClickHouse.
If using your own schema, we recommend creating a Logs source ensuring the required fields are specified - see ["Log source settings"](/clickstack/managing/config#logs) for further details.
Schema choice: Map vs JSON
ClickStack stores attributes as `Map(LowCardinality(String), String)` columns by default. This is the recommended schema for observability workloads. Combined with [bucketed map serialization](/reference/data-types/map#bucketed-map-serialization) and text indexes on map keys and values, it provides selective lookups without the per-key ingest overhead of dynamic JSON subcolumns.
A `JSON`-typed schema is available in beta for evaluation on workloads with a small, stable attribute key-set. It is **not recommended** as the default. See [Map vs JSON type](/clickstack/ingesting-data/schema/map-vs-json) for the full comparison and the env vars required to enable JSON support.